Opens in a new tab

Thank you for your interest in Captivation Agency's suite of creative storytelling services!

To ensure we give every client relationship the attention it deserves, we limit the number of new clients we onboard each month.

There are currently 3 remaining slots available for October, and we'd love to learn about your upcoming project to see how we can help!

Get In Touch.

To get started, please complete the form below, or if you would prefer to connect with us immediately, please feel free to call our studio line at: 888-456-2083
We look forward to hearing from you!
For Nonprofit Marketers

The Impact Report That Pulls Donors In

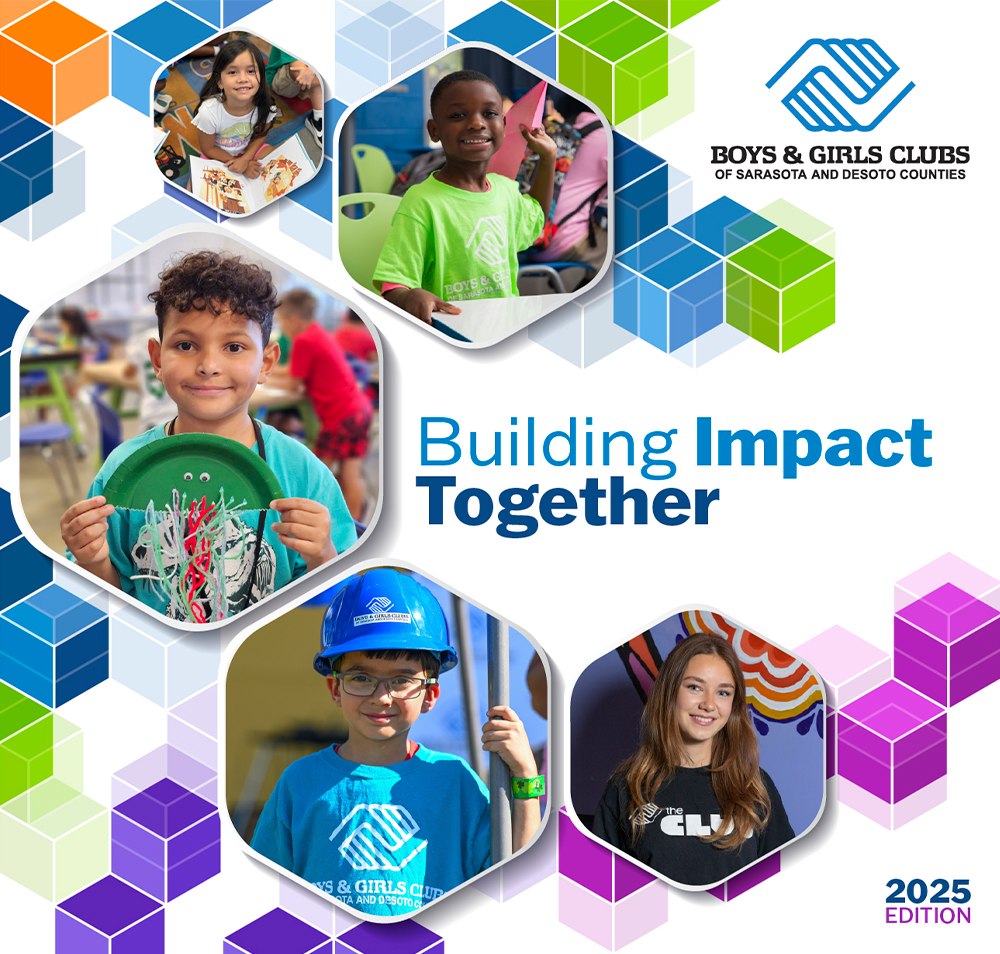
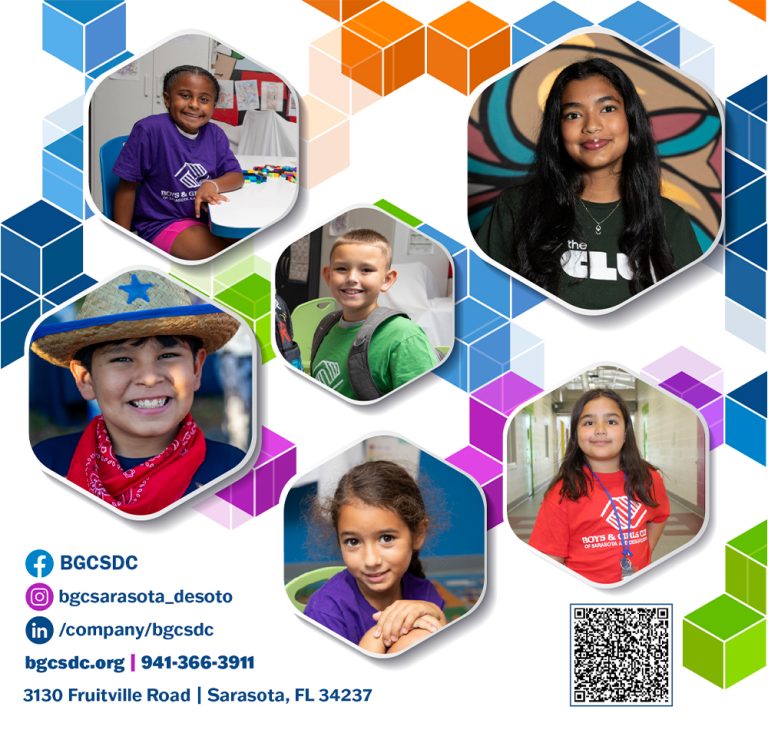
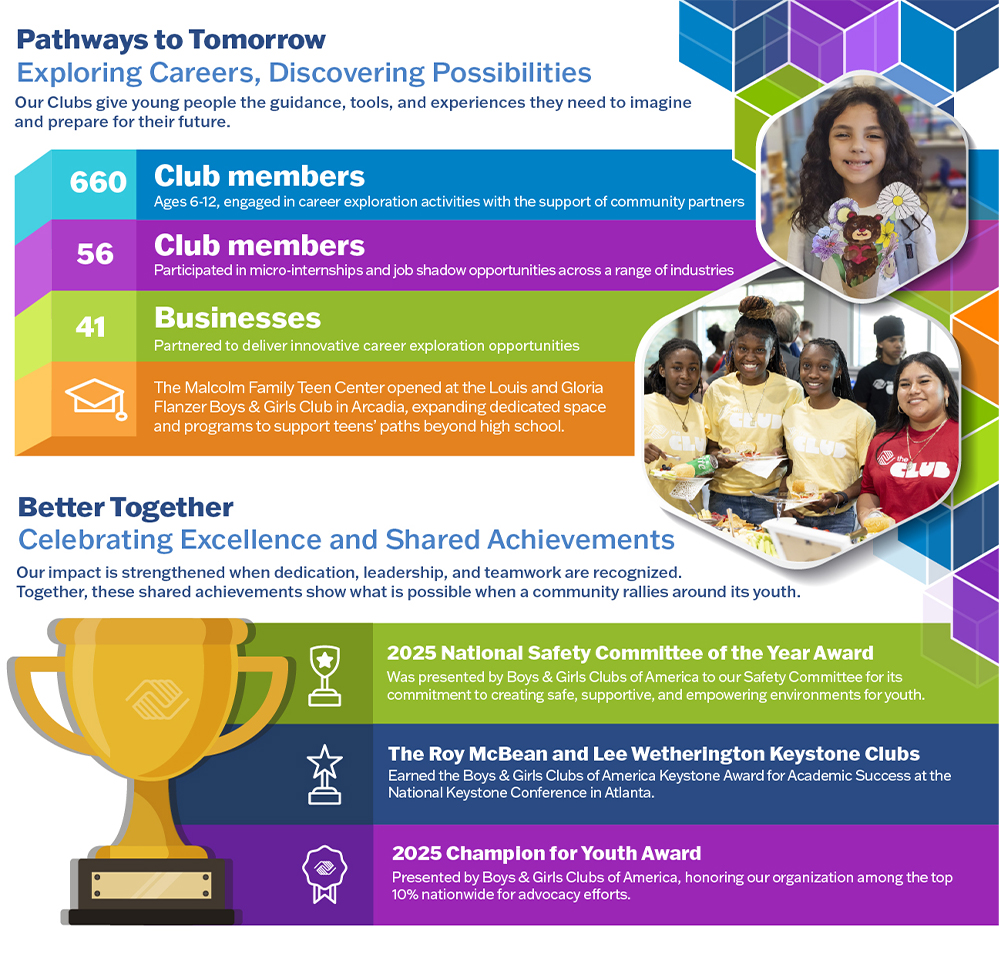
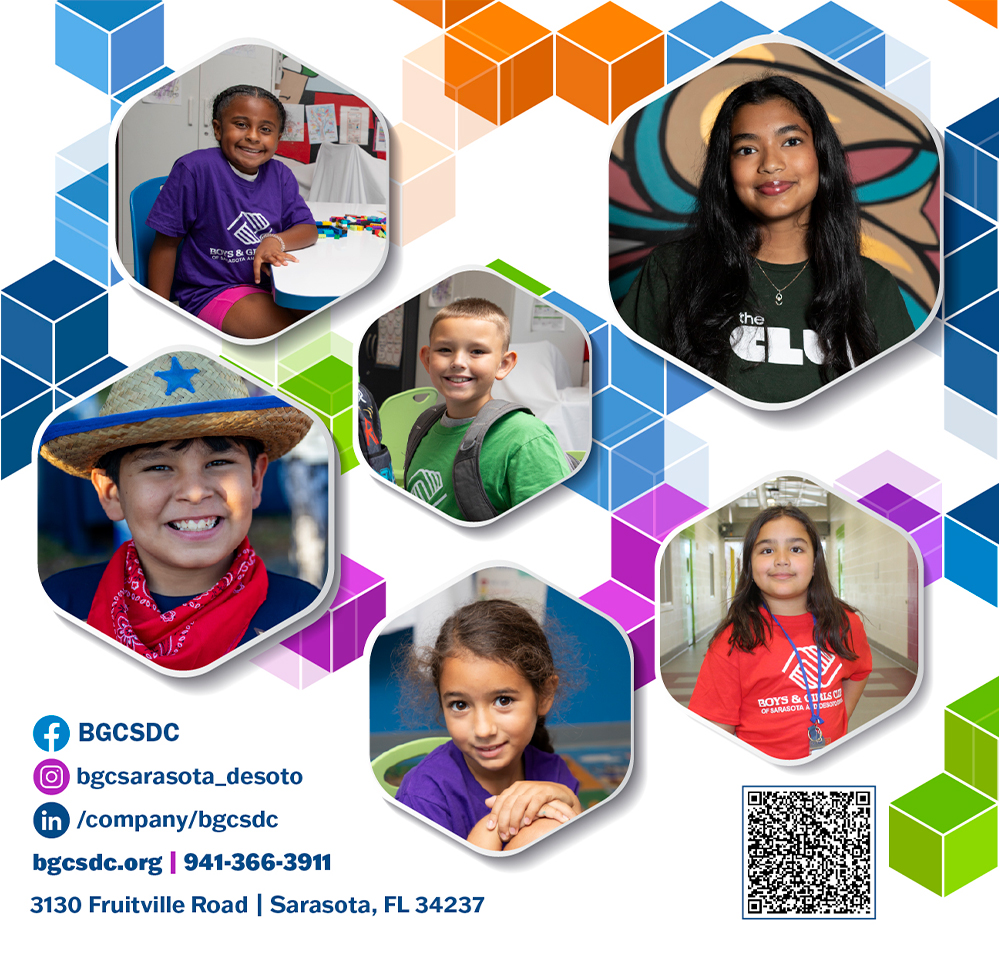
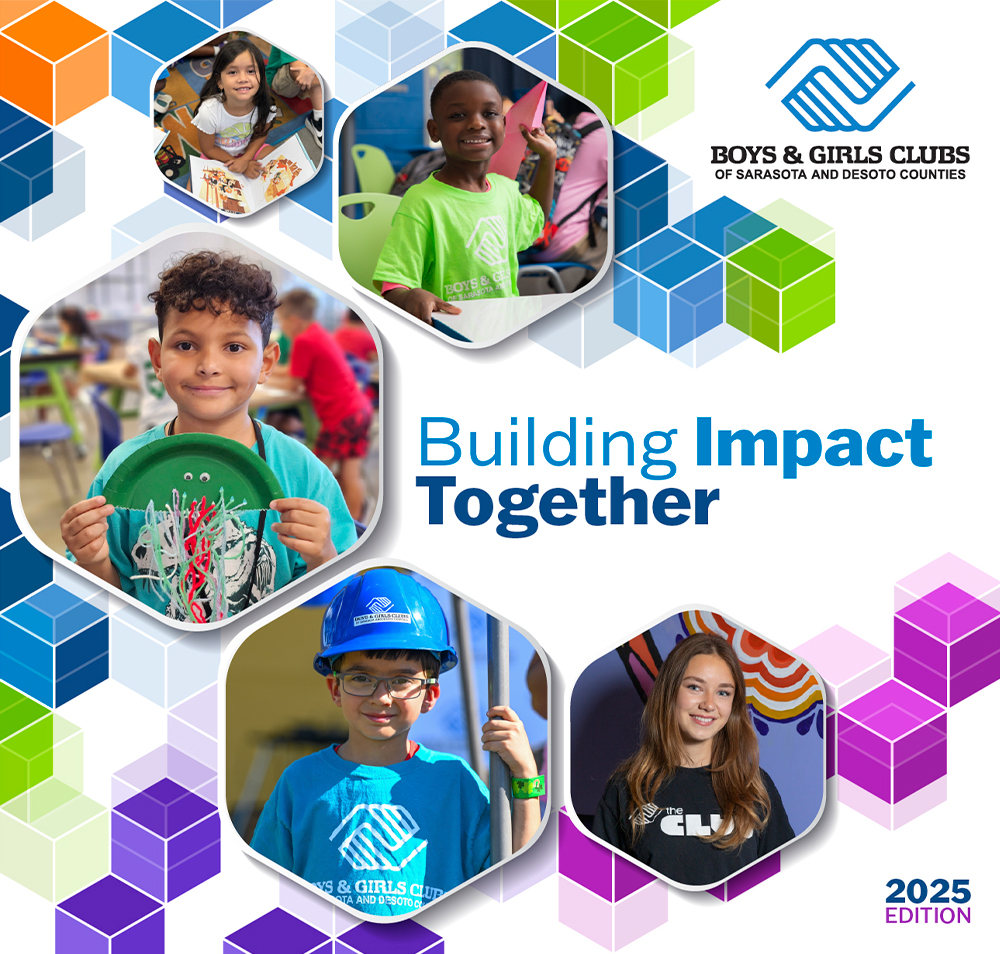
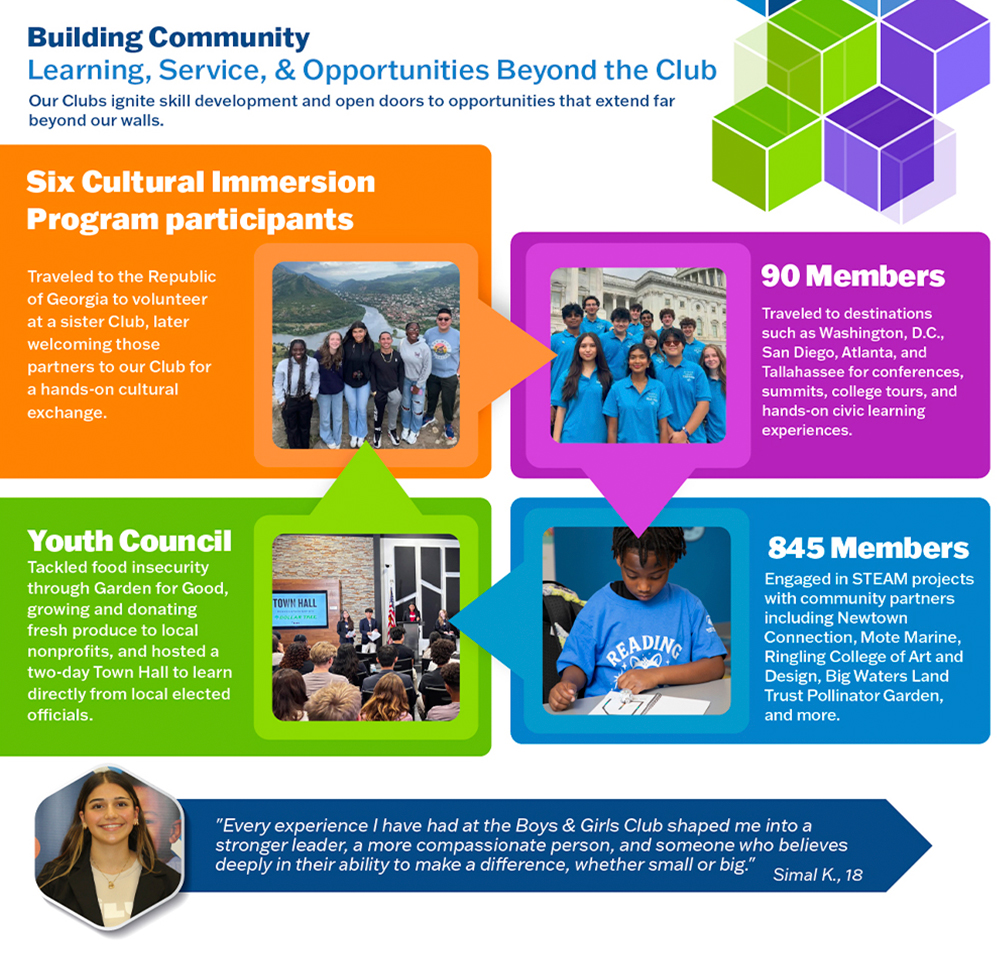
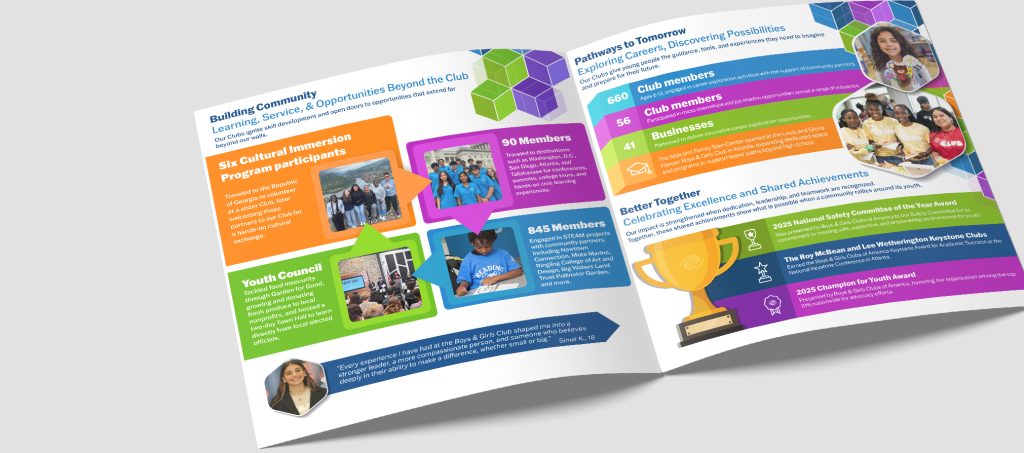
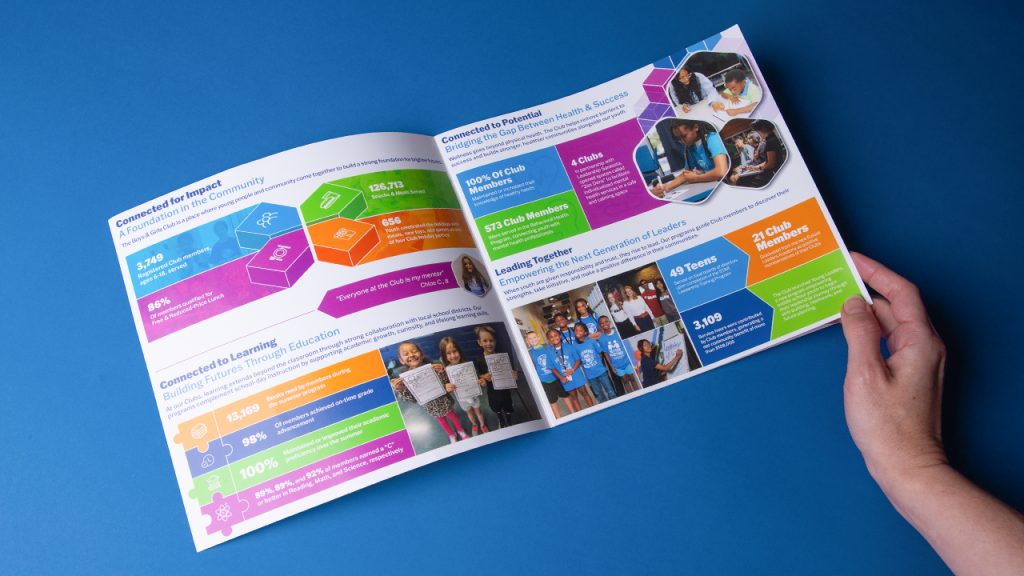
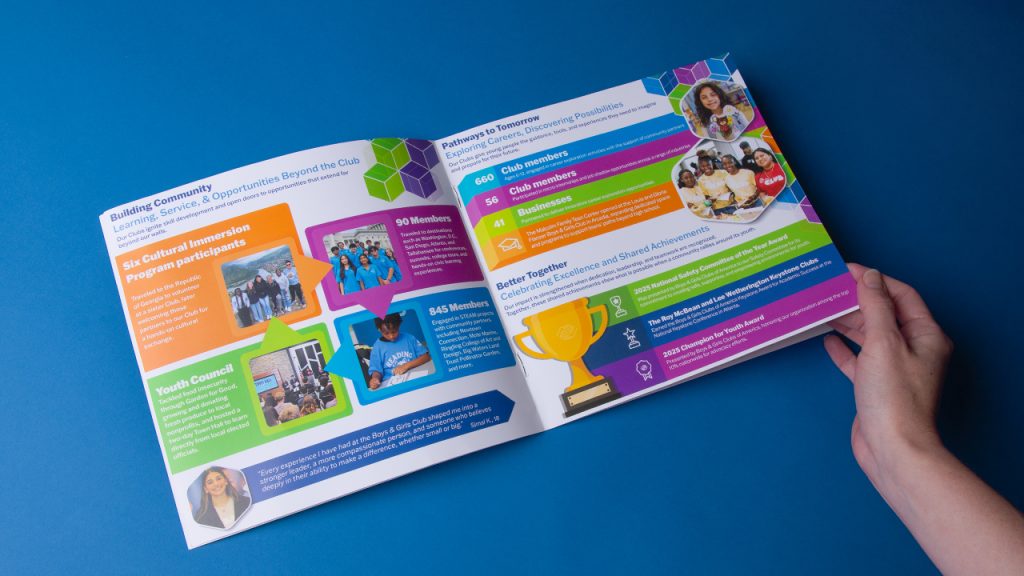
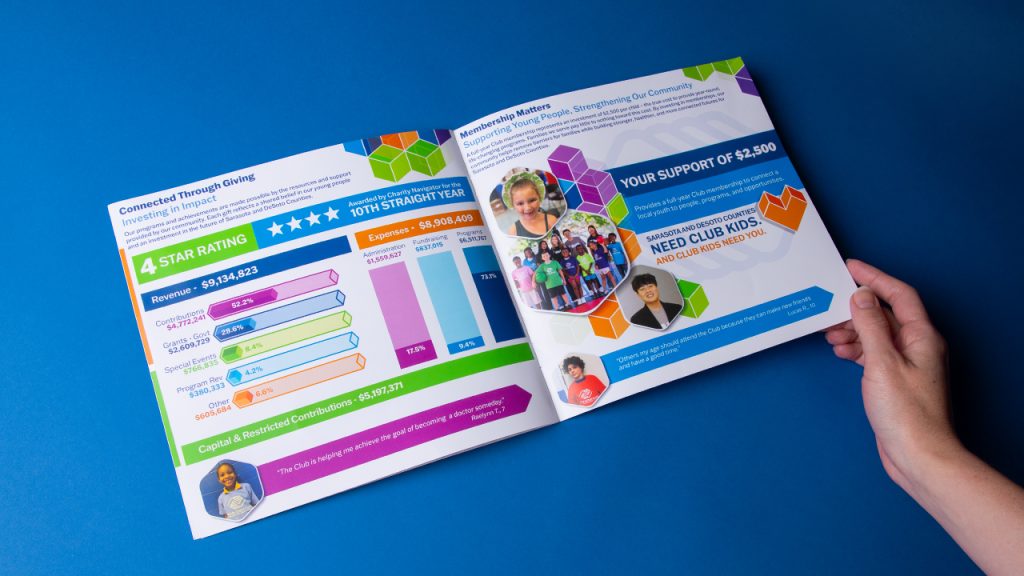
With Boys & Girls Clubs of Sarasota and DeSoto Counties, we shaped a year of program data, financials, and member stories into one clear, scannable report, built for donors who skim and supporters who want the whole picture.
Client: Boys & Girls Clubs of Sarasota and DeSoto Counties
Services: Graphic Design
Industry: Nonprofits
The 120 Case Study

The Whole Story in 120 Seconds.

The Situation

Your nonprofit just finished a strong year. The numbers are real, the stories matter, and the people who fund your mission deserve to see it. But most annual reports get a glance and a close. The challenge isn’t proving impact. It’s presenting it so donors, funders, and board members move through the whole thing.

The Opportunity

The Boys & Girls Clubs of Sarasota and DeSoto Counties had a year worth showing: thousands of members served, strong academic outcomes, and a clear financial picture. The task was to take all of it, the data and the stories, and shape it into one report that felt as meaningful as the work behind it.

The Approach

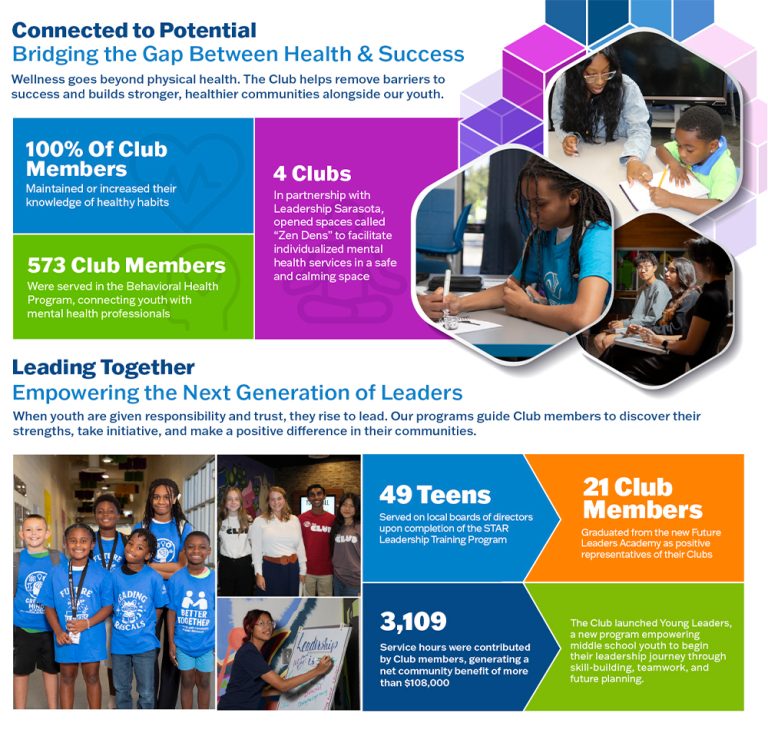
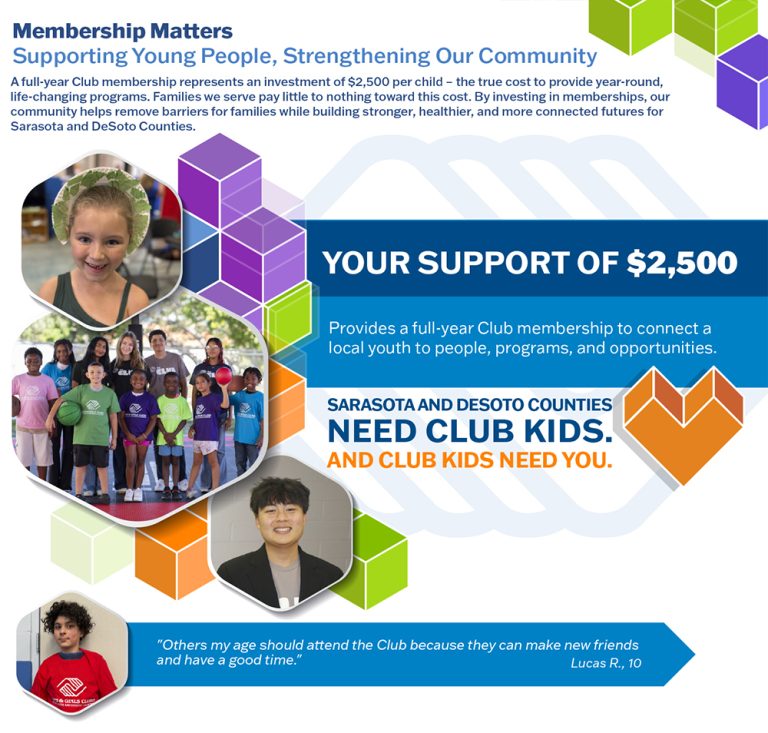
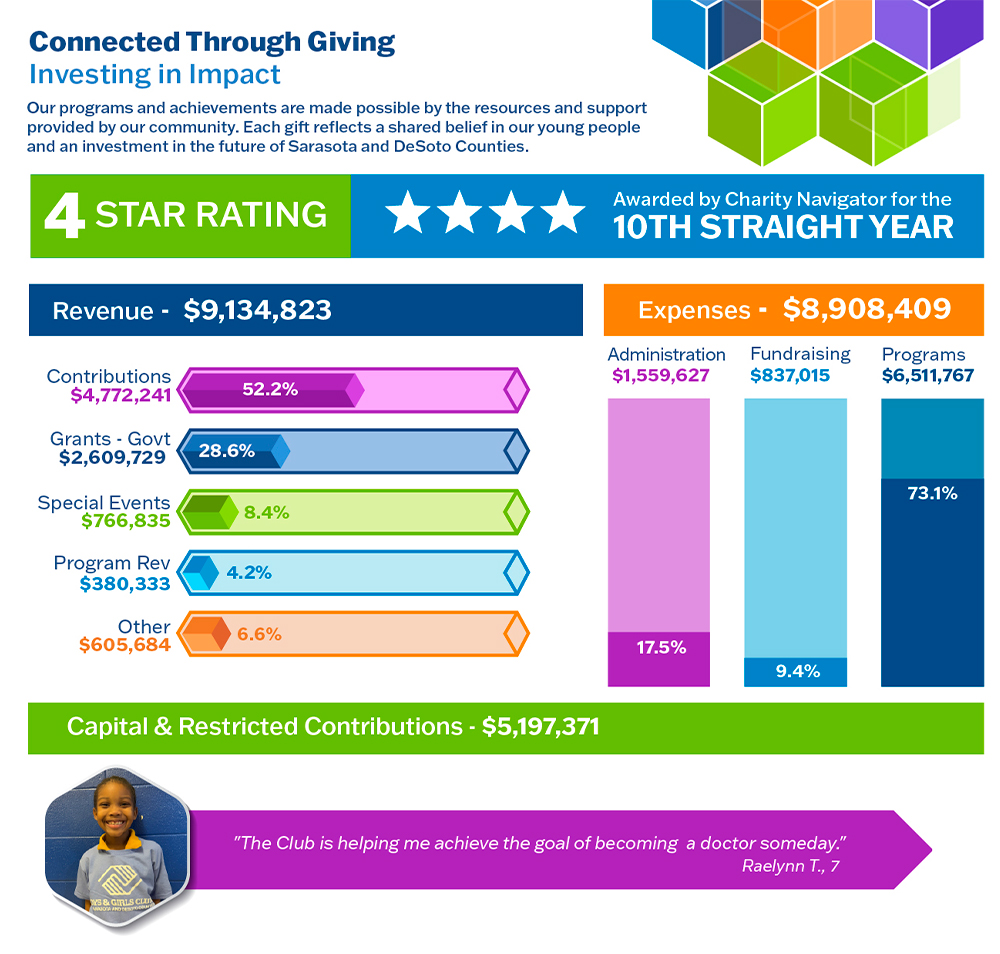
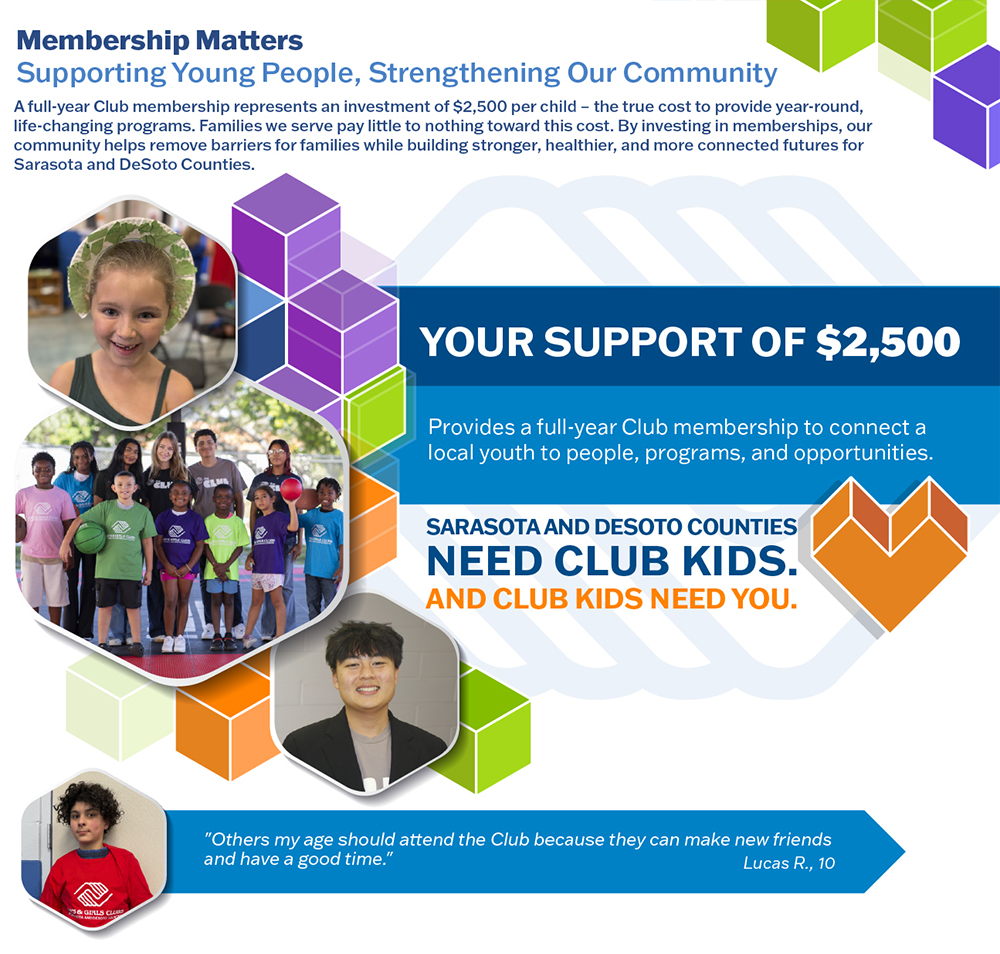
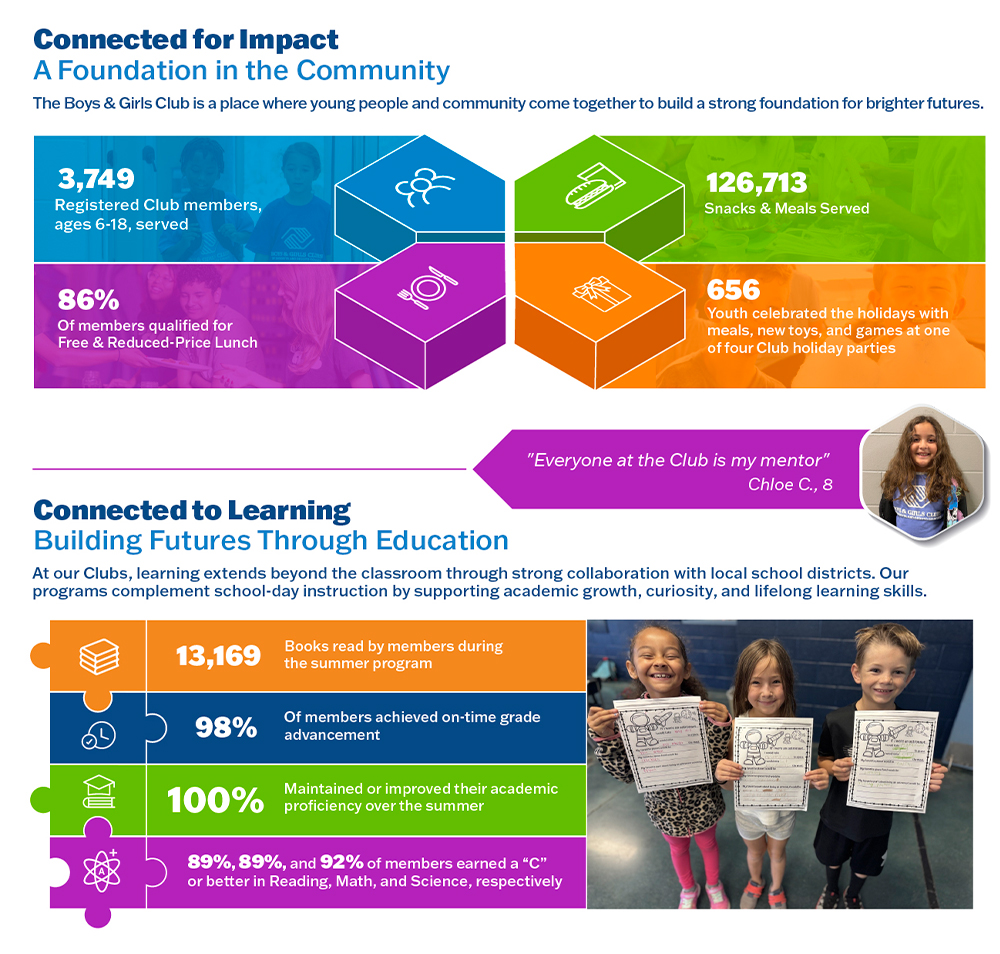
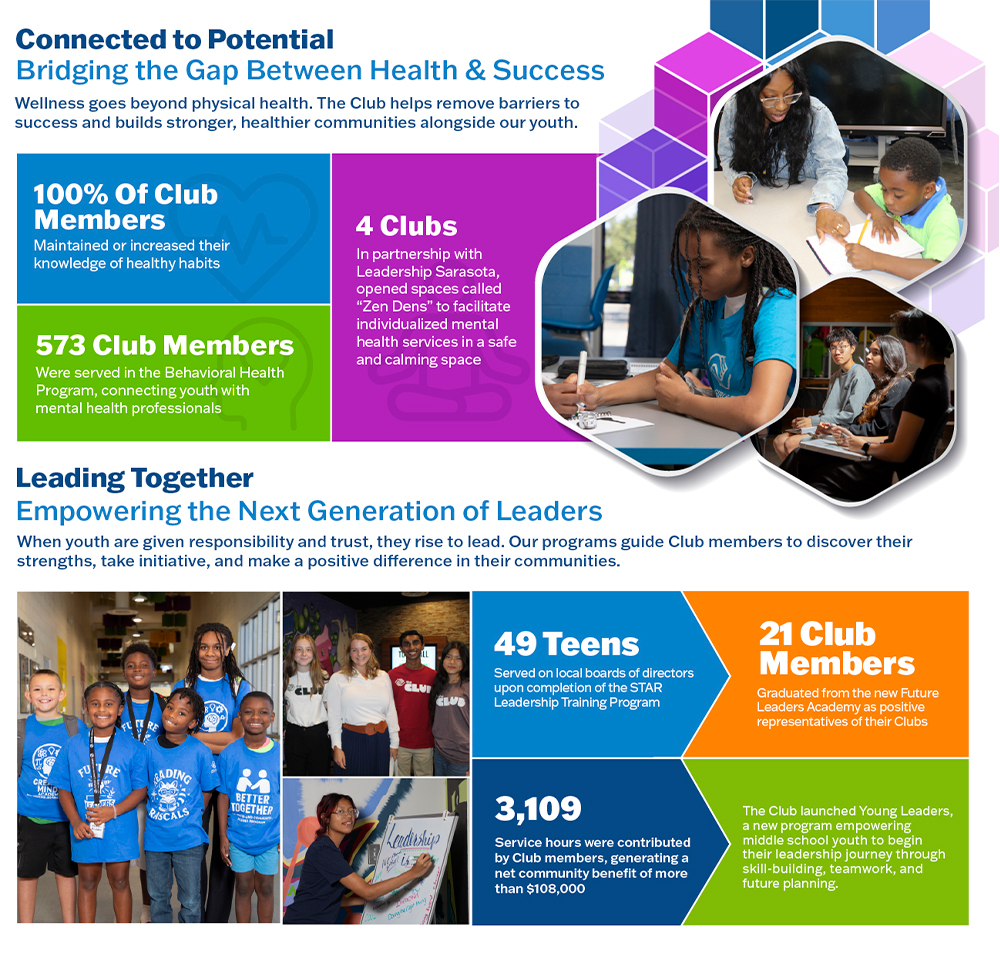
We started with the reader, not the layout. Working from the year’s program data, financials, and member stories, we built a clear visual system, section by section and stat by stat, so the report reads in scannable pieces. Icons, pull stats, member quotes, and a clean financial breakdown each carry one idea, tied together by the Club’s brand.

The Impact

The report stopped being a once-a-year handout and became a tool the organization uses all year. The same story now reaches supporters in three places, in hand at events, in inboxes, and online, so the Club’s impact stays in front of donors, funders, and board members long after the year closes, without a new design every time someone asks to see it.

The So What

Most of the work that goes into an annual report is spent proving impact. Far less is spent making sure that impact gets seen. But a report only earns its keep when people actually move through it, and keep coming back to it. That’s a design problem before it’s a printing one, and it’s where the right creative partner changes what a year of work is worth.

01

Boys & Girls Clubs of Sarasota and DeSoto Counties

Since 1970, the Boys & Girls Clubs of Sarasota and DeSoto Counties has helped local youth ages 6 to 18 build brighter futures through after-school and summer programs across its Sarasota, Venice, North Port, and Arcadia clubs. The programs support academic success, character development, healthy lifestyles, and career readiness, but the organization’s reach goes well beyond programming, built on decades of community roots and donor relationships.

Each year, that work adds up to a story worth telling: thousands of members served, meals provided, academic gains, leadership milestones, and the financial picture behind it all. The annual impact report is how the organization brings that story to the people who make it possible, the donors, funders, board members, and the broader community.

02

A Year of Work, and One Shot at Being Seen

An impact report carries a lot of weight. It has to account for a full year of programs, outcomes, financials, and the people behind the numbers, and present it to the supporters who fund the mission and decide whether to keep giving.

The difficulty is rarely the content. The organization had a strong year and the data to prove it. The difficulty is attention. A report this important tends to run dense, and dense reports get skimmed, set down, and forgotten, no matter how good the year was.

So the real challenge was making a year of meaningful work feel just as meaningful on the page. Every stat had to land. Every section had to earn the next scroll. And the whole thing had to hold up for a donor giving it thirty seconds and a board member reading every line.

⚡ The Decision Point

The report couldn’t live in just one place. Supporters meet the organization in different ways, in the room at an event, in an inbox, on the website, and a single PDF wouldn’t reach all of them well. The decision was to design one cohesive report built to work across three formats from the start, rather than stretch one version to do every job.

03

Start With the Reader, Not the Layout

Most reports start with everything the organization wants to say. We started with how someone would actually read it.

Before any layout, we looked at who opens an impact report and how. A donor scanning on a phone. A funder checking the financials. A board member reading start to finish. Each one needs the same story, but none of them reads it the same way, and a report built only for the careful reader loses everyone else.

So we shaped the content around the skim first. Outcomes lead. Numbers are pulled out and made visible. Stories sit where they carry the most weight. The reader who only gives it a glance still walks away with the year’s impact, and the reader who wants the full picture finds the depth waiting underneath.

💡 The Insight That Shaped Everything

A report isn’t read in order. It’s scanned, then read. Once we designed for the scan first, every section had to make its point before a reader decided whether to keep going. That one shift drove the whole system: lead with the outcome, make the number the hero, and let the story reward the people who stay.

04

One Story, Built to Hold Together

With the reader in focus, we built a complete visual system for the report, one the organization could carry across every format without losing consistency.

Each section was structured around a single clear idea: a headline outcome, the stats that prove it, and the human story that makes it real. Icons give every metric a visual anchor. Pull stats turn a year of data into something scannable. Member quotes ground the numbers in real lives. And the financials are laid out plainly enough to build trust at a glance, instead of being buried in a table.

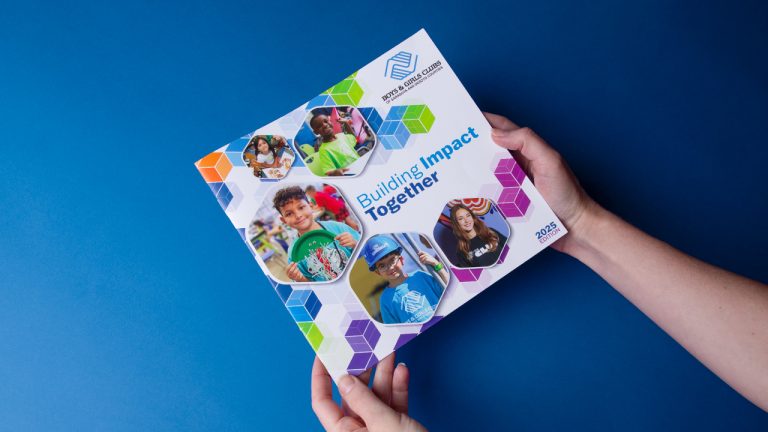
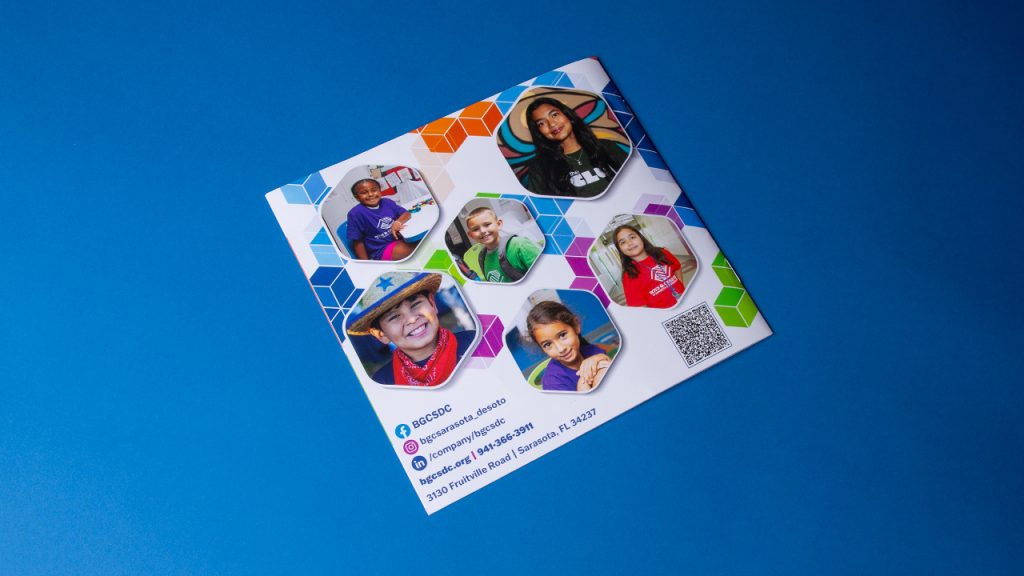
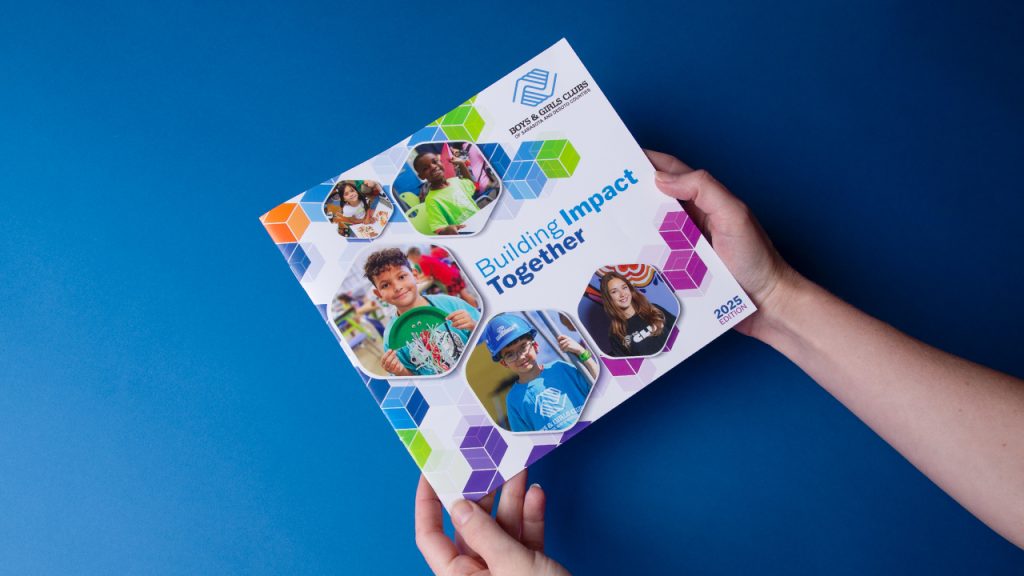
Then we built it to travel. The same report became a printed piece handed out at Club events, a downloadable PDF for inboxes and grant packets, and a page on the organization’s website. Each one true to the Club’s brand, each one carrying the identical story, so it feels cohesive no matter where a supporter meets it.

05

A Report That Keeps Working

Here’s what changed. The impact report stopped being a once-a-year handout and became something the organization uses all year.

Because it lives in three formats, the story reaches supporters wherever they are, in hand at an event, in an inbox, on the website. And because it was built once, as one cohesive system, the organization doesn’t need a fresh design every time someone asks to see the year’s impact. It’s ready for a donor meeting, a grant application, or a board review on demand.

That’s the difference between a report that documents a year and a report that works for the mission well beyond it.

What This Means For You

If You're the One Building the Report, This One's for You.

If your organization puts out an annual impact report, you know how much rides on it. It carries a full year of work, the programs, outcomes, financials, and the people behind the numbers, and it goes straight to the supporters who decide whether to keep believing in your mission.

The hard part usually isn’t the content. You had a strong year and you have the data to show it. The hard part is attention. A report this important is easy to make dense, and dense reports get skimmed and set aside, no matter how good the year was.

That’s where the right creative partner makes the difference. When the report is designed around how people actually read it, the year’s impact lands. The donor giving it thirty seconds still walks away with the story. The funder finds the financials. The board member who reads every line finds the depth. And when it’s built to work in print, as a PDF, and on your site, one report keeps earning its place all year, in donor meetings, grant packets, and board reviews.

You don’t need to say more. You need a report that gets read, gets reused, and makes a year of work feel as significant on the page as it was in the field.

That is exactly the kind of work we do.

Questions We Get Asked

You're Probably Wondering...

Yes. We've worked with organizations across Sarasota for years, and we build the design package around real impact, not maximum scope. The goal is a report that earns its keep all year, in donor meetings, grant packets, and on your site, so the investment keeps paying off well past the launch.

Always. The report is built to feel unmistakably like your organization, your colors, type, and visual identity carried through every section and every format. The point is consistency: a supporter should recognize it as yours whether they're holding the printed piece or scrolling the web version.

No. The report is built once as a single cohesive system, then adapted for print, PDF, and web. The heavy lifting, the structure, the visual language, the way each section is built, is shared across all three. Adapting that foundation for each format is far less work than designing three reports from scratch.

Most impact reports take one to three months, depending on how ready the content is and how many formats are in play. Once the data, financials, and stories are gathered, the design moves efficiently. The earlier we're brought in, the more we can help shape how the year's story gets told, not just lay it out after the fact. That early window is where the strongest reports come together.

You bring the raw material: the year's program data, financials, member stories, and quotes. We shape it into something readable, deciding what leads, which stats get pulled out, where a story lands hardest, and how it all flows. You know your year better than anyone; our job is to make it land on the page.

Ready to Write Your Own Story?

You Have a Bigger Story to Tell

A strong year shouldn’t end up in a report that gets skimmed and set aside.

The work is already done. The programs ran, the numbers are real, the stories matter. What’s left is making sure the people who fund your mission actually see it, move through it, and remember it. That’s a design decision, and it’s where a year of work either lands or gets lost.

If your organization has an impact report that needs to do more than document the year, it may be time for a partner who can make it work in print, on screen, and online, and keep working long after launch.

That starts with a conversation.

Schedule Your Strategic Consultation
No hard pitch. Just a strategic conversation about getting you back to what you do best.
More Client Work

You Might Also Like These.